Should you sell your stocks before this correction gets worse?
Key Takeaways
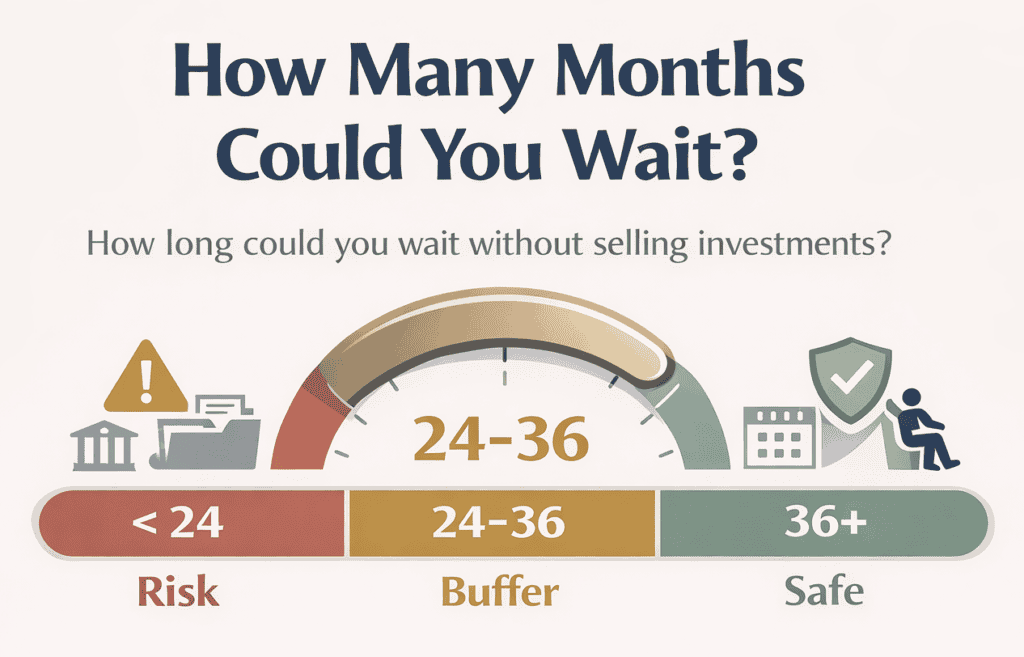
- Calculate your cash reserves in months – aim for 24-36 months to avoid forced selling during corrections
- If still working, maintain 401k contributions during corrections to buy shares at discounted prices
- Withdrawal rates above 6% during market downturns create dangerous structural problems
- Don’t sell after a 10% drop – you’re locking in losses when 78% of corrections recover within 12 months
- Your age determines strategy: corrections are buying opportunities at 58 but forced-selling risks at 73
Markets fell five straight weeks. Major indexes dropped over 10% from February peaks. Bond yields climbed above 4.3%.
Oil hit $110 per barrel. The combination creates the kind of anxiety that makes even experienced investors question their plans.
This article won’t predict when markets recover. Instead, it will help you figure out whether this correction threatens your specific situation and what that means at your particular stage of retirement planning.
Should You Sell Now Before It Gets Worse?
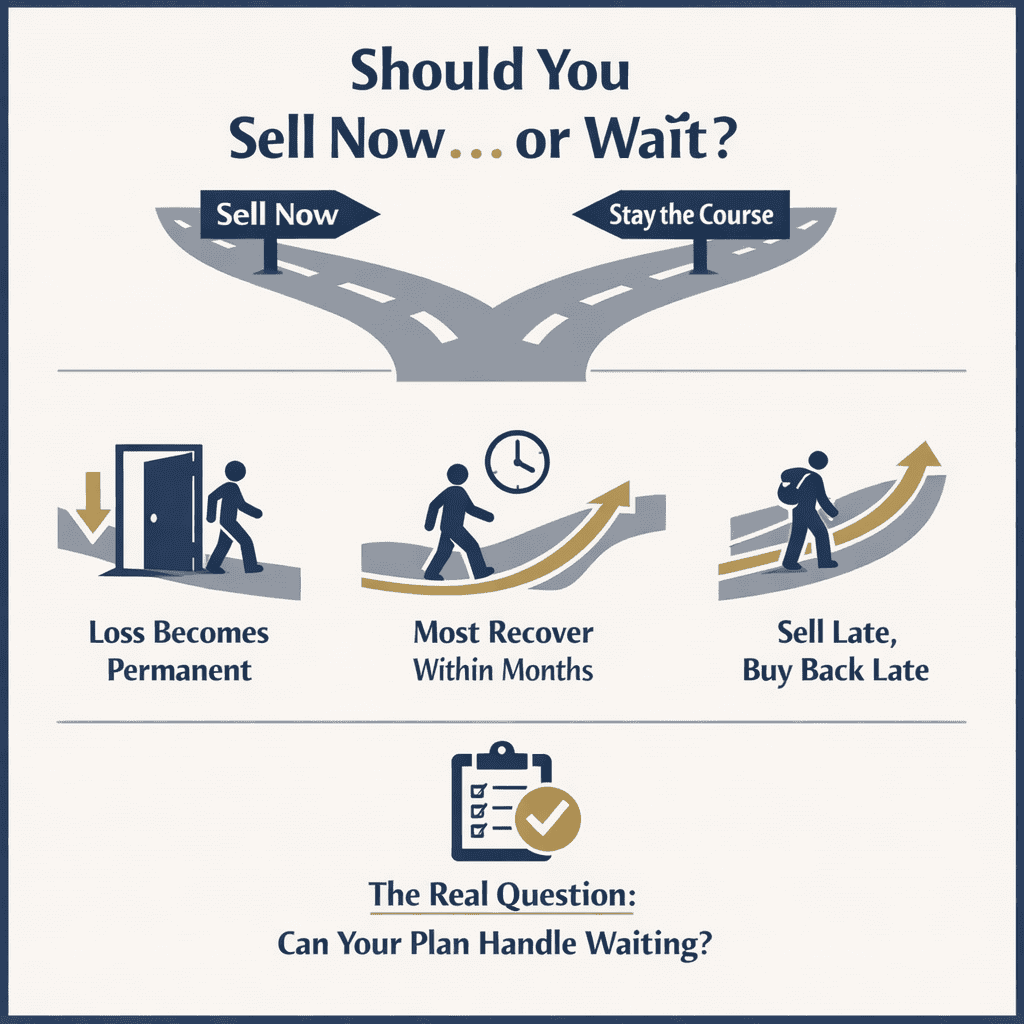
Selling after markets already fell 10% usually makes things worse, not better. You’re locking in losses. What’s down 10% on paper becomes a permanent 10% loss when you sell.
According to Vanguard’s analysis of S&P 500 corrections since 1980, roughly 78% recovered to previous highs within 12 months. The median recovery time was four months. But that average includes both quick recoveries, like 2020’s five-month bounce, and longer grinds like 2011’s 19-month correction.
If you sell now and markets recover in six months, you miss the recovery. If you sell now and markets fall another 10%, you still lost that first 10%, and now you’re sitting in cash wondering when to get back in. The research on market timing is clear: most investors who sell during corrections get both decisions wrong. They sell after the drop and buy back after the recovery.
The better question isn’t whether to sell. It’s whether your plan can handle waiting for recovery. And that answer depends entirely on your age and situation.
Why Your Age Changes Everything
A 58 year old and a 73 year old facing the same 10% correction need completely different strategies. Not similar strategies. Different strategies.
If you’re 58 with seven years until retirement, you have something most retirees don’t: time. Research from Vanguard shows investors who maintained their 401k contributions during market corrections ended up 12-18% ahead of those who stopped contributing. You’re essentially buying stocks at a 10% discount right now.
Every paycheck that goes into your retirement account buys more shares than it did two months ago. This is dollar-cost averaging in action, buying more shares when prices are low, fewer when prices are high.
The emotional instinct is to stop throwing money at a falling portfolio. The data says that’s exactly backwards. If you have seven years before retirement, corrections aren’t threats.
They’re buying opportunities. The question isn’t whether to pull back. It’s whether you have the emotional tolerance to keep contributing, or even increase contributions if you have room in your budget.
If you’re 62 and planning to retire at 63, this correction does change your calculus. Say you were targeting $1 million and you’re sitting at $900,000 after this drop. If you contribute another $30,000 over the next year, you’d have roughly $930,000 plus whatever market recovery occurs.
That might close the gap. Or it might mean working one more year to let the portfolio rebuild.
Here’s where Social Security timing enters the picture. If you were planning to start benefits at 62, delaying to 63 or 64 increases your monthly payment by roughly 6–8% per year. If your portfolio needs time to recover, delaying Social Security gives it that time while also locking in a permanently higher monthly benefit. It’s not the worst trade-off when markets are down.
If you’re 68 and already retired, the critical question is cash reserves. Can you cover two to three years of spending without selling stocks? If yes, this correction is stressful but not dangerous.
You can wait for recovery without forced selling. If no, you’re pulling money from a portfolio that’s down 10%, which means selling more shares to generate the same dollars. That’s when temporary market drops create permanent portfolio damage.
Research on sequence of returns risk, the danger of bad markets early in retirement, shows the first five years of retirement are critical. According to studies by financial planner Michael Kitces and professor Wade Pfau, a portfolio experiencing negative returns in years 1-5 of retirement has a significantly higher failure rate than identical portfolios that experience the same negative returns later. Cash reserves are your buffer against that risk.
If you’re 73 or older, you face the hardest situation: required minimum distributions. You must take money out regardless of market conditions. If your RMD is $40,000 and your account is down 10%, you’re selling more shares to generate that $40,000. This is forced selling at exactly the wrong time.
The strategy here isn’t whether to take the RMD (you must), but which account you pull from. If you have cash reserves or stable bonds, take the RMD from those rather than selling stocks. If you have flexibility on timing, consider taking the RMD later in the year to give the portfolio more time for potential recovery. These tactical decisions matter more at 73 than they do at 58.
The Cash Reserve Calculation That Determines Everything
Here’s how to figure out whether this correction is dangerous or just uncomfortable for your specific situation.
Take everything you could access without selling stocks, (checking accounts, savings, money market funds, short-term bonds that don’t fluctuate in value), and divide by your monthly spending. The number you get is your coverage in months.
If that number is under 24 months, you’re in forced-selling territory during corrections. You’ll need to pull money from stocks while they’re down. Between 24 and 36 months, you have breathing room.
Most corrections resolve within that window. Over 36 months, you can wait out nearly any correction without stress.
This is why financial planning conversations during good markets often focus on cash reserves. Not because cash earns returns; it barely does. But because cash buys time. And time is what lets you avoid selling stocks at the worst possible moment.
There’s a reason this number matters more than your stock allocation or your risk tolerance. During the 2020 correction, portfolios with adequate cash reserves survived without structural damage. Portfolios without cash reserves were forced to sell stocks at the March lows.
When markets recovered five months later, one group participated fully. The other group had already locked in losses.
Why Your Withdrawal Rate Matters More During Corrections
How much you’re pulling from your portfolio each year changes everything during corrections.
The 4% withdrawal rate guideline comes from William Bengen’s research in the 1990s and the Trinity Study’s analysis of historical portfolio survival rates. According to that research, a retiree withdrawing 4% annually from a balanced portfolio had a 95% probability of making the money last 30 years, even when retiring into bad markets.
But notice what happens when withdrawal rates climb. Say you had $1 million and were withdrawing $40,000 per year; a 4% rate. After this 10% correction, you’re at $900,000.
If you continue withdrawing $40,000, that’s now 4.4% of your portfolio. Still manageable. The portfolio has room to recover.
Now say you were withdrawing $70,000 per year; a 7% rate. After the same 10% correction, you’re pulling 7.8% from a $900,000 base. If the correction lasts 12 months and you continue those withdrawals, you’re taking nearly 8% annually from a declining portfolio.
That’s not a temporary dip. That’s a structural problem.
This is sequence of returns risk in action. Two portfolios with identical allocations can end up in very different places based on withdrawal rates during corrections. According to Morningstar’s research on retirement income, portfolios withdrawing above 6% during market corrections had failure rates three times higher than portfolios withdrawing 4% during the same corrections.
When Bonds Don’t Provide the Expected Safety
Many retirees expected bonds to hold steady while stocks fell. That’s not what’s happening this time.
Bond yields climbed above 4.3% in March. When yields rise, bond prices fall. Treasury auctions saw the weakest demand in over three years. This means both stocks and bonds are under pressure simultaneously; something that doesn’t happen in every correction.
This is exactly why cash reserves matter more than portfolio allocation during certain corrections. When both parts of your portfolio face stress, cash is the only thing that doesn’t require selling at unfavorable prices. It’s not elegant.
It’s not optimized. But it works.
If you assumed your bond allocation would provide stability during this correction and it hasn’t, that’s not a failure of planning. It’s a reminder that some market environments are different. The playbook that worked in 2018’s correction or 2020’s correction doesn’t automatically work in every correction. This is why cash reserves sit outside the portfolio optimization discussion; they’re insurance, not returns.
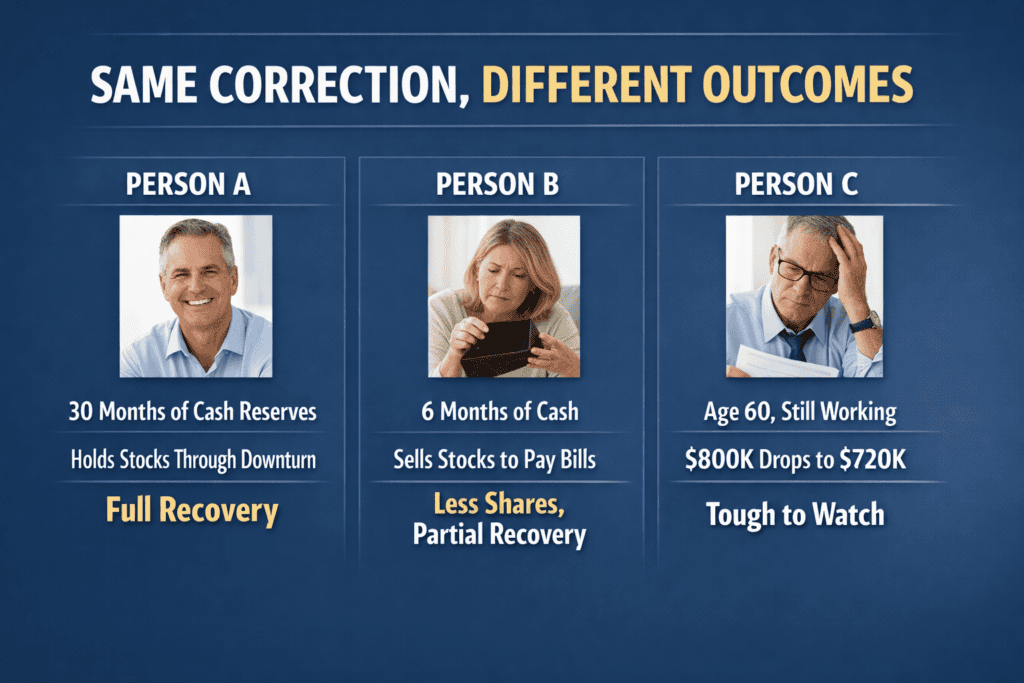
THREE HYPOTHETICAL SCENARIOS: SAME CORRECTION, DIFFERENT OUTCOMES
Person A has 30 months of cash reserves. Doesn’t touch stocks during the correction. When markets recover, stock holdings recover fully. No permanent damage.
Person B has six months of cash. Must sell stocks monthly to cover spending. By the time markets recover, they’ve sold at depressed prices and hold fewer shares. When recovery comes, they participate less.
Person C is 60, still working, still contributing to 401k. The correction drops their balance from $800,000 to $720,000. Painful to watch.
But their monthly contributions now buy shares 10% cheaper. Five years later when they retire, the correction was one of the best things that happened to their portfolio.
Same correction. Three different structures. Three completely different outcomes.
✓ Curious how many months of expenses you could cover without selling stocks during a market downturn? Take our 3-minute Correction Readiness Assessment and discover your cash coverage timeline plus specific strategies for your age and situation.
How Some People Use Corrections Strategically
Most people think about corrections defensively: Can I survive this? But there are offensive moves that make sense if you’re positioned well.
If you’re still working and have high cash reserves, this correction makes Roth conversions more valuable. You’re converting when your IRA is down 10%. Pay tax on $90,000 to convert what will hopefully grow back to $100,000 and beyond.
The same conversion in February would have cost you tax on the full $100,000. The correction created a 10% discount on the tax bill.
But this only works if you have cash to pay the conversion taxes without selling. If you’d have to liquidate stocks to pay the tax bill, you’re just moving the forced selling from one account to another.
Rebalancing is another strategic move during corrections, but only if you have the cash reserves to do it without stress. If your target allocation is 60% stocks and you’re now at 55% because stocks fell, using cash to buy stocks brings you back to target. You’re buying low without selling anything.
According to Vanguard’s research on rebalancing, investors who maintained their target allocations through corrections by buying stocks when they fell below target ended up with higher returns over 20-year periods. But notice the key phrase: ‘buying stocks when they fell.’ If you don’t have cash and must sell bonds to rebalance, you’re trading one declining asset for another. The strategy only works with dry powder.
What to Monitor and When to Make Changes
The question isn’t just whether your plan can handle this correction. It’s what happens if the correction lasts longer than expected.
Every month during an active correction, check three numbers: your portfolio value, your remaining cash coverage in months, and your actual spending against budget. You’re not checking these to react to every movement. You’re checking to see if you’re still in the same risk zone or if you’ve moved into different territory.
If you started with 30 months of cash coverage and you’re now at 26 months after three months of correction, you’re still fine. If you started with 20 months and you’re now at 16 months, you’re moving toward forced-selling territory. That’s when you start looking at spending cuts, not panic cuts, but intentional reductions in discretionary spending to extend your runway.
Quarterly, recalculate your withdrawal rate. If you started the year at 4.5% and you’re now at 5.2% because the portfolio shrank, that’s something to note. If you climb above 6–7%, that’s when withdrawal rate becomes a structural concern rather than a temporary adjustment.
There are also trigger points worth defining in advance. If cash coverage drops below 18 months, that’s a signal to cut discretionary spending immediately. If the correction extends past 15 months, that’s outside the historical norm and worth reassessing your entire plan. If the portfolio drops another 10% from here, entering bear market territory, that’s a different playbook.
The goal of monitoring isn’t to make you anxious. It’s to catch problems early when you still have options, rather than late when you’re forced into decisions.
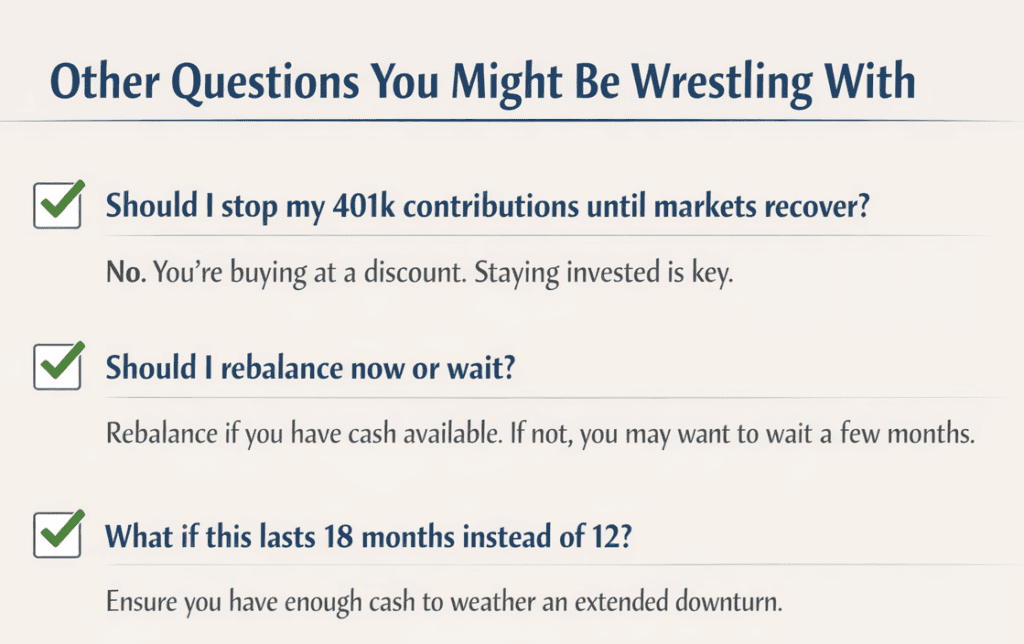
Other Questions You Might Be Wrestling With
Should I stop my 401k contributions until markets recover?
If you’re still working with years before retirement, no. You’re buying at a discount. DALBAR’s annual analysis of investor behavior consistently shows that investors who reduce contributions during corrections underperform those who maintain contributions by 2–3% annually.
The instinct to stop feels protective. The data says it’s costly.
Should I rebalance now or wait?
If you have cash reserves and your stocks fell below target allocation, rebalancing now means buying low. If you don’t have cash and would need to sell bonds to rebalance, consider waiting three to six months to see if markets stabilize. Rebalancing is a good strategy. Forced rebalancing during dual stress in stocks and bonds is less clear.
What if this lasts 18 months instead of 12?
This is why cash coverage matters. If you have 30 months, you’re fine. If you have 20 months, you’d need to cut spending by 20–30% to extend your coverage into the longer timeframe. The monthly monitoring system above is designed to catch this early, not late.
What This Means for You
Corrections don’t create problems. They reveal problems that were already there.
If you have adequate cash reserves, sustainable withdrawal rates, and appropriate time horizons, this correction is stressful but not dangerous. The portfolio structure you built during good markets is doing exactly what it’s supposed to do during bad ones.
If you’re discovering gaps — low cash coverage, high withdrawal rates, uncomfortable timeline pressures; those gaps existed before the correction. The correction just made them visible. And visible problems can be addressed. Hidden problems can’t.
The families who reach the end of retirement with confidence aren’t the ones who avoided every correction. They’re the ones whose plans were built to survive corrections. That’s not luck. That’s structure.
Your next step depends on what you discovered reading this article. If you calculated your cash coverage and found 30 months, you likely just need monitoring, not changes. If you found 15 months, or if your withdrawal rate is above 6%, those are structural questions worth addressing with someone who can see your full situation.
Either way, you now know the difference between reacting from fear and responding from strategy. And that difference is worth more than any market prediction.
Do You Need Help?
Need help evaluating your specific numbers? We can walk through your cash coverage, withdrawal rate, and timeline together to see whether adjustments make sense.
About the Financial Planning Author
Alex Langan, J.D., CFBS
Alexander Langan, J.D, CFBS, serves as the Chief Investment Officer at Langan Financial Group. In this role, he manages investment portfolios, acts as a fiduciary for group retirement plans, and consults with clients regarding their financial goals, risk tolerance, and asset allocation.
With a focus on ERISA Law, Alex graduated cum laude from Widener Commonwealth Law School. He then clerked for the Supreme Court of Pennsylvania and worked in the Legal Office of the Pennsylvania Office of the Budget, where he assisted in directing and advising policy determinations on state and federal tax, administrative law, and contractual issues.
Alex is also passionate about giving back to the community, and has participated in The Foundation of Enhancing Communities’ Emerging Philanthropist Program, volunteers at his church, and serves as a board member of Samara: The Center of Individual & Family Growth. Outside of work and volunteering, Alex enjoys his time with his wife Sarah, and their three children, Rory, Patrick, and Ava.
About Langan Financial Group: Financial Advisors
Langan Financial Group is an award-winning financial planning firm with offices in York, Pennsylvania and Harrisburg, Pa.
With over 150+ 5-star reviews, Langan Financial Group is an independent financial planning firm established in 1985, offering a broad range of financial planning services.
With an open architecture platform, our advisors have access to a diverse range of products, free from any sales quotas.
Our team of 11 financial experts, each with unique specialties, enhances our ability to focus on delivering value to our clients.
Disclosure
The content is developed from sources believed to be providing accurate information. The information in this material is not intended as tax, financial or legal advice.
Please consult financial, legal, or tax professionals for specific information regarding your individual situation.
The opinions expressed and material provided are for general information, and should not be considered a solicitation for the purchase or sale of any security.
Securities offered through Cambridge Investment Research, Inc., a Broker/Dealer, Member FINRA/SIPC.
Investment Advisor Representative, Cambridge Investment Research Advisors, Inc. a Registered Investment Advisor. Cambridge and Langan Financial Group, LLC are not affiliated.
Cambridge does not offer tax or legal advice.