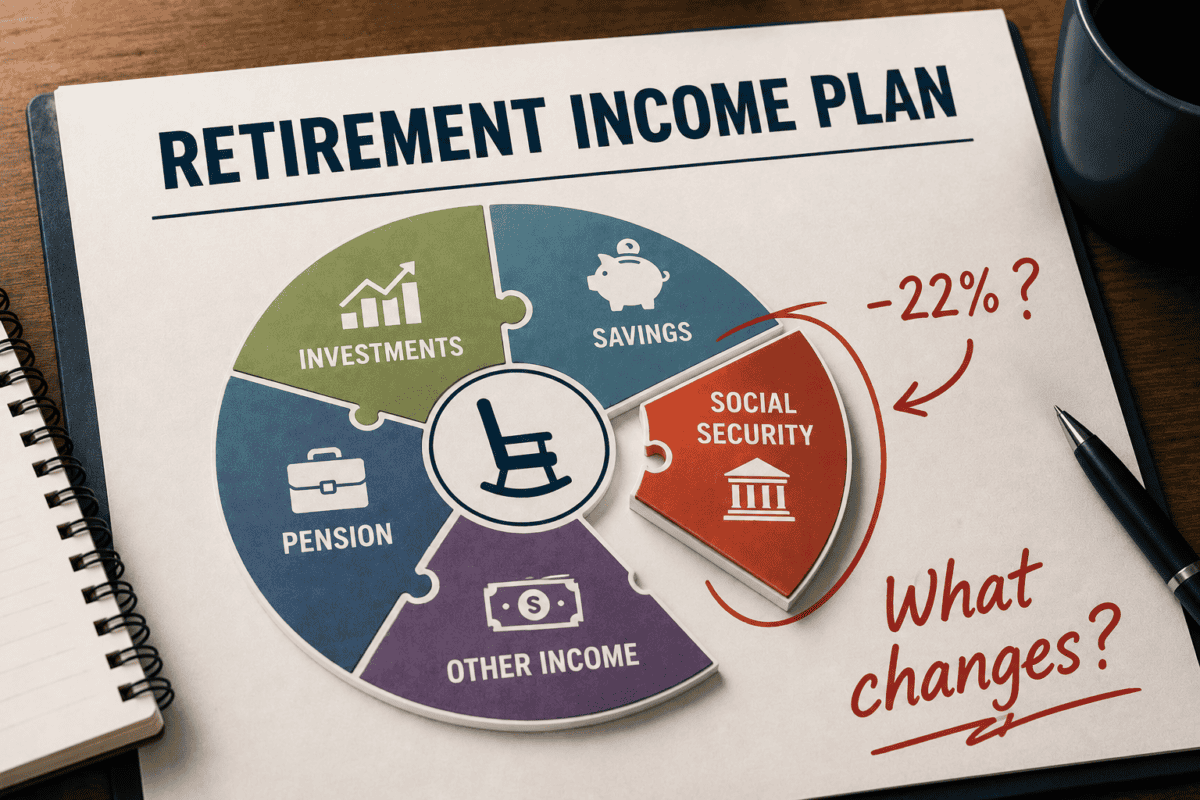
Key Takeaways
- Claiming Social Security early locks in permanently reduced benefits, making future cuts hit harder on an already smaller base.
- Waiting until age 70 to claim produces a higher monthly check even after a 22% cut than claiming at 62.
- Evaluate your personal retirement plan numbers before assuming a Social Security cut will seriously impact your household finances.
Most people understand that a Social Security cut would be bad. What they have not done is look at their own retirement plan and ask: bad for whom? And by how much? The answer depends almost entirely on one number most households have never calculated.

The First Instinct Is Usually Wrong
When most people read about a potential Social Security cut, the first thought is some version of: I should claim now, before they reduce it. Get the money while it is still there.
It feels logical. It is not.
Claiming Social Security early locks in a permanently reduced benefit, potentially a third less per month than if you had waited to full retirement age. That reduction never goes away. Now layer a 22% cut on top of a benefit you have already shrunk.
You are not getting ahead of the problem. You are making it worse on both ends.
A household that waits until 70 and then faces a 22% cut still ends up with a higher monthly check than one that claimed at 62. Same cut. Bigger base wins.
Bigger base, same percentage. The math protects the household that waited.
Claiming timing is a separate decision from the solvency question, and it should stay that way. If your health or financial situation makes early claiming the right call on its own terms, that conversation is worth having with an advisor. But the 2032 projection is not a reason to claim early. It is a reason to look carefully at your plan.
The Number That Tells You Everything
Whether a Social Security cut is a minor inconvenience or a serious problem comes down to one thing: how much of your essential monthly spending does Social Security currently cover?
Essential spending means the bills that show up no matter what. Mortgage or rent. Utilities.
Groceries. Insurance premiums. Healthcare costs.
Transportation. Not travel. Not restaurants.
The fixed floor your household has to cover every single month.
If Social Security covers 30% of that floor, a 22% cut means you lose about 7% of your essential income. Painful but not structural. Your other income sources are doing the heavy lifting already.
If Social Security covers 80% of that floor, a 22% cut means roughly 18% of your essential expenses suddenly have no income behind them. That is a different conversation entirely.
Same cut. Completely different households. Same headline. Completely different retirement impact.
The Calculation Takes About Five Minutes
Divide your monthly Social Security benefit by your monthly essential expenses. Multiply by 100. That percentage is your Social Security Dependence Ratio. It tells you how much of your essential spending floor is held up by one income source.
The free Social Security Stress Test tool this week walks through this calculation and shows you the result in about five minutes. The worksheet version lets you work through it on paper. Either way, the number you get back changes how this conversation feels. It stops being about Social Security in general and starts being about your household specifically.

What Each Result Actually Looks Like at the Kitchen Table
There are four situations most retirement households fall into. Here is what each one actually looks like in plain terms, not financial planning language.
If Social Security covers less than 50% of your essential expenses
A 22% cut would reduce your monthly income. It would probably reduce your discretionary spending: the trips, the restaurants, the extras. But your mortgage still gets paid.
Your utilities still get paid. Your grocery bill still gets covered. Your other income sources, whether that is a pension, portfolio withdrawals, rental income, or some combination, are carrying most of the weight.
Social Security is a meaningful supplement. It is not the thing holding the floor up.
The question worth asking in this situation is not whether you can survive a cut. You likely can. The question is what a higher withdrawal rate from your savings does to your long-term picture.
If you have to pull more from your portfolio to replace the lost Social Security income, does your savings last as long as your retirement? That is the number worth running.
Question for your advisor: “If Social Security is reduced by 22%, what does that do to my withdrawal rate? Does my savings still hold up over a 25 to 30 year retirement?”
If Social Security covers 50% to 80% of your essential expenses
A 22% cut creates a real gap between what is coming in and what has to go out every month. Your essential bills do not change. Your Social Security check does.
The difference has to come from somewhere: savings, a part-time job, cutting spending, or help from family. None of those options are easy, and none of them were in the original plan.
The key question here is not whether you have savings to draw from. It is whether drawing from them at a higher rate is sustainable for a retirement that might last another 20 or 25 years. A gap of $400 a month does not sound catastrophic.
But that is $120,000 over 25 years. That is real money from a savings account that was supposed to last a lifetime.
Question for your advisor: “Can you show me what my savings looks like over 20 and 30 years if I have to draw an extra $400 to $600 per month starting in 2032?”
If Social Security covers more than 80% of your essential expenses
A 22% cut means your essential bills are no longer fully covered by your income. Not by a little. Significantly.
This is the situation where a cut does not just reduce the extras. It affects the basics. The mortgage.
The utilities. The food budget. Something has to give, and the options are not comfortable ones.
This is also the most common situation for households that built their retirement plan around Social Security as the foundation, with limited other income. There is nothing wrong with how those plans were built at the time. But 2032 is close enough that adjustments made between now and then could meaningfully change the outcome. That is worth a focused conversation before the window closes.
Question for your advisor: “What could we build or change between now and 2032 to reduce how much my essential expenses depend on Social Security?”
If Social Security covers most of your expenses and your savings are limited
This combination, heavy reliance on Social Security with little behind it, is where a potential cut is most serious. Not because the situation is hopeless. But because the margin for error is small, and the time to address it is now rather than in 2031.
Some households in this situation have more options than they realize. Timing of other withdrawals. Part-time income.
Spending adjustments that are manageable now and could meaningfully shift the picture. But those options require a clear-eyed look at the numbers, and that conversation is worth prioritizing above most other financial decisions right now.
Wondering how a potential Social Security cut would actually affect your retirement income? The math looks different for everyone depending on when you claim and what you have saved. Schedule a conversation with our team to run the real numbers on your specific situation.
Question for your advisor: “Given how much my income depends on Social Security, what steps could we take now to build more of a cushion before 2032?”
A Note for Married Couples
If your household receives two Social Security checks, a 22% cut reduces both. Add your combined monthly benefit and run the ratio against your combined essential expenses. That is your real exposure number, not just one check in isolation.
There is a second issue specific to couples. When one spouse passes, the smaller of the two Social Security checks stops. The surviving spouse keeps the larger one.
But household expenses rarely fall by the same amount. A 22% cut makes that survivor gap worse. If this applies to your household, it is worth factoring into how you think about your income plan well before 2032.
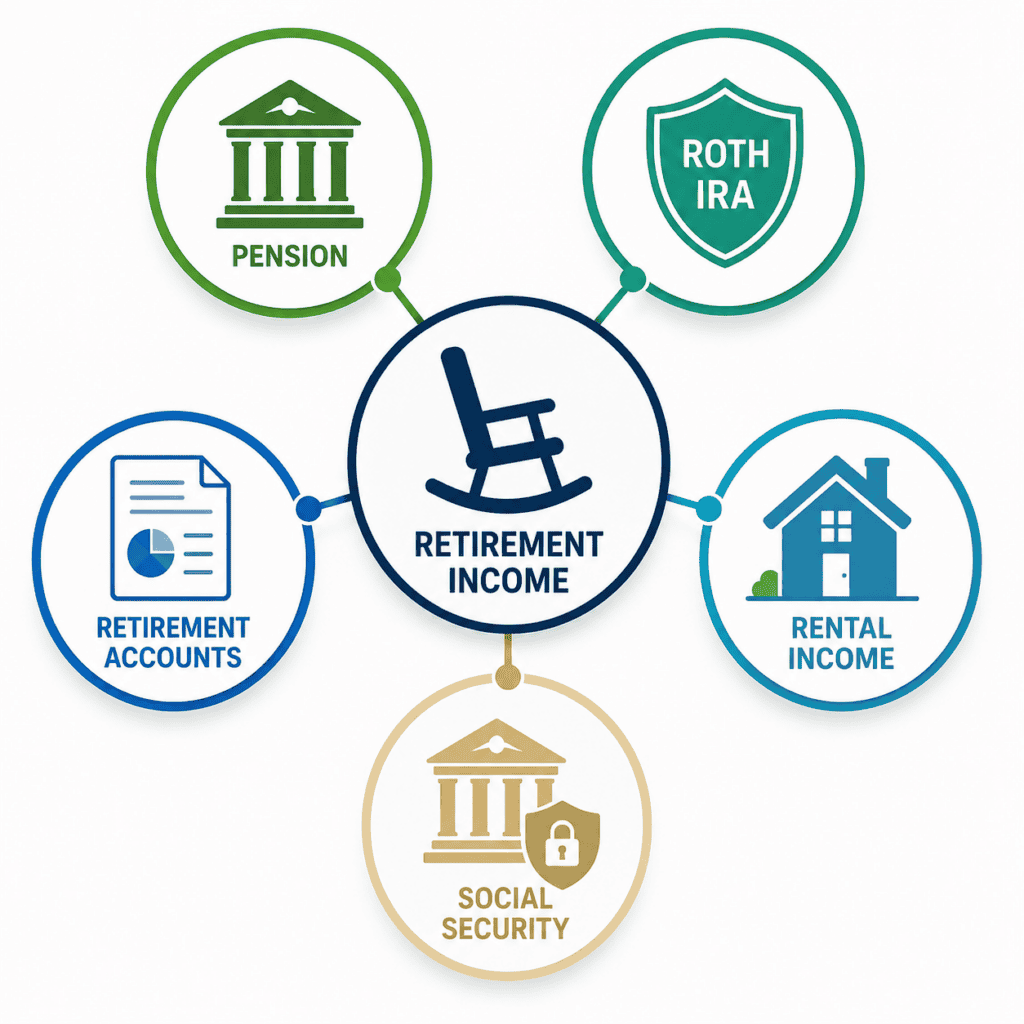
The Income Sources That Are Not Affected by This
One useful exercise right now: make a list of the income sources in your plan that have nothing to do with Social Security. Not to replace Social Security. But knowing what is and is not at risk gives you a clearer picture of where you actually stand.
A pension from a former employer is not connected to Social Security. It has its own funding, its own risk profile, and its own payment schedule. For households with meaningful pension income, a Social Security reduction is a smaller percentage of the total picture.
Savings in a Roth IRA carry no required annual withdrawals during the owner’s lifetime. Qualified withdrawals are not subject to federal income tax. For some households, this may be worth discussing with a tax-qualified advisor as one option for covering a gap created by a Social Security reduction.
Portfolio withdrawals from an IRA or 401(k) can fill gaps but carry their own risk. The key question is not whether you have the money. It is whether pulling more of it earlier affects how long it lasts.
That is why the online tool this week includes a longevity estimate alongside the dependence ratio. The two numbers together tell a more complete story than either one alone.
Rental income and other non-market income sources are also independent of Social Security solvency, though they carry their own risks around vacancies, maintenance costs, and property markets.
Get Your Number This Week
Everything above is about the average household. What matters is your household. The Social Security Stress Test tool linked in this week’s newsletter takes about five minutes.
It produces four specific numbers. Your dependence ratio. The monthly gap if a 22% cut occurs.
The extra withdrawal rate your savings may need to cover that gap. And a rough estimate of how long your savings may last at the higher rate.
Prefer paper? The free worksheet covers the same ground. It takes about 15 minutes with a pen and your most recent statements.
Either way, what you end up with is not a prediction. It is a picture. A picture of where your retirement stands today.
A risk that may or may not materialize. And enough time to act if the picture shows a gap.
Six Years Is Enough Time to Change the Picture
The 2032 projection is not a reason to panic. It is a planning window. Six years is a meaningful amount of time to restructure a retirement income plan if the picture you got from the stress test shows real exposure. Here are the most direct levers available, depending on where you are.
Strategy 1: Reduce How Much Your Essential Expenses Depend on Social Security
The dependence ratio is not fixed. It can be reduced before 2032 by building income sources that are not tied to Social Security. For pre-retirees, this may mean growing a pension, building annuity income, or making sure savings are large enough to generate meaningful distributions. For retirees already drawing, it may mean reviewing whether your current income architecture relies too heavily on a single government program.
It may also mean deliberately restructuring spending. If your essential expenses can be covered by your pension, portfolio, and other income, Social Security becomes a supplement rather than a foundation. That shift in structure changes how a potential cut lands, even if your total spending does not change.
This is one of the most powerful moves available to a household in the Exposed or Vulnerable profile, and it does not require earning more money. It requires reorganizing what income source covers which bills.
Strategy 2: Consider Roth Conversions While the Window Is Open
For pre-retirees and younger retirees with money in traditional IRAs or 401(k) accounts, converting some of those assets to Roth may be worth discussing with a tax-qualified advisor. A Roth conversion means paying income tax now on the amount converted, in exchange for tax-free withdrawals later. It also reduces the balance subject to required minimum distributions at age 73, which lowers future taxable income.
Why this matters for 2032: a Roth IRA produces no required withdrawals and no taxable income on qualified distributions. It does not increase the taxable portion of your Social Security benefit. And it is completely independent of Social Security solvency.
For a household in the Exposed or Vulnerable profile, building Roth assets over the next six years may provide meaningful flexibility. Whether a conversion makes sense depends entirely on your tax situation, and this is not a recommendation. It is a conversation worth having before 2032 rather than after.
Strategy 3: Think Carefully About Which Account You Draw From First
If you need to pull from savings to cover a Social Security gap, the order matters more than most people realize. Drawing from a traditional IRA adds to your taxable income for the year. That can push you into a higher tax bracket, increase the taxable portion of your Social Security benefit, and potentially trigger IRMAA Medicare surcharges. Drawing from a Roth IRA instead produces no taxable income, does not affect Social Security taxation, and does not count toward IRMAA thresholds.
This is the difference between covering a $500 monthly gap and covering it efficiently. Same dollar amount. Very different tax outcome depending on which account it comes from.
Withdrawal sequencing is one of the most underused tools in retirement income planning, and it becomes significantly more valuable if Social Security income drops. This is worth mapping out with an advisor before the gap exists, not after.
Strategy 4: Use the Time Remaining to Build a Buffer
For pre-retirees in the Vulnerable or Critical profile, the next six years represent the last meaningful window to build savings before Social Security becomes the primary income source. Even modest additional saving compounded over six years can materially change the longevity calculation the stress test produces. A household that enters 2032 with an extra $50,000 in savings has roughly $5,000 to $6,500 per year in additional buffer at a 4% withdrawal rate. That can cover a meaningful portion of a Social Security gap without restructuring anything else.
For retirees already drawing, the buffer strategy looks different. It may mean preserving more of your current savings by drawing less now, or identifying spending that can be reduced voluntarily before a potential cut forces the issue. A spending review before 2032 is a very different conversation than a spending reduction after a cut arrives. Individual results will vary significantly.
“The households that handle this well are not the ones who predicted what Congress would do. They are the ones who looked at their own plan clearly enough to know what would happen if Congress did nothing.”
Langan Financial Group
Not Sure Which Situation Describes Your Household?
We run this kind of analysis with families regularly. A complimentary review can show you exactly where your household falls, what a 22% reduction would mean for your specific income and expenses, and whether any adjustments are worth making before 2032.
Curious how your retirement plan holds up under different Social Security scenarios? Explore strategies designed to help protect your income regardless of how policy shifts unfold. Download our retirement planning guide to discover approaches that go beyond relying on one income source.
Schedule a Complimentary Review
Or call us at 717-288-1880
This article is provided for informational and educational purposes only and does not constitute investment, tax, legal, or Social Security planning advice. All investing involves risk, including potential loss of principal. Individual results will vary.
The household situations described are illustrative examples only and are not intended to represent specific individuals or predict specific outcomes. The Social Security Dependence Ratio, plan profiles, reduction scenarios, and strategies referenced are educational planning tools, not projections, guarantees, or recommendations. Social Security projections are from the 2026 Social Security Trustees Report.
Reduction percentages assume no congressional action and are not predictions of future benefit levels. Profile thresholds are illustrative planning benchmarks, not universal standards. References to Roth IRA conversions, IRA, 401(k), and portfolio withdrawals are illustrative educational examples only and do not constitute investment, tax, or legal recommendations.
Roth conversion suitability depends entirely on individual tax circumstances and is not appropriate for all investors. Roth IRA qualified distribution rules reflect current law and may change. Withdrawal sequencing strategies referenced are illustrative only and do not constitute tax or investment advice.
The savings buffer example is illustrative only. Individual results will vary significantly. Income annuity and pension suitability depends entirely on individual circumstances.
Please consult a qualified financial, tax, or Social Security planning professional before making any decisions based on information in this article. Securities offered through Cambridge Investment Research, Inc., a Broker-Dealer, Member FINRA/SIPC. Advisory services through Cambridge Investment Research Advisors, Inc., a Registered Investment Adviser.
Langan Financial Group and Cambridge are not affiliated.