
Four Checks That Tell You.
A self-assessment for adults age 50 and older. Each check takes about five minutes. Together, they tell you exactly where your plan stands.
Key Takeaways
- Build a cash buffer covering 3-4 years of expenses to avoid selling investments during market downturns
- Guaranteed income should cover at least 60% of essential expenses to reduce portfolio dependence
- Selling during market declines costs more than the initial loss since you miss the recovery
- Check if your investment mix drifted more than 5% from target after volatile periods
- Behavioral coaching prevents reactive decisions worth 1.5% annually in portfolio returns
Here is something most financial articles will not say to you directly: most people who worried about their portfolios this spring will complete these four checks and find that their plan held up. The market dropped roughly 7%. It recovered. If your structure was in place, that sequence played out exactly the way a well-built plan is supposed to handle it.
But some people will find a gap. A position that was sold during the decline. A cash buffer that does not exist.
An investment mix that no longer matches the plan. And the people who find those gaps now, in a calm moment, are in a far better position than those who discover them during the next volatile stretch.
This article does not offer general reassurance. It gives you four specific checks with clear instructions for running each one. At the end, a simple framework helps you interpret what you find. You will know, in plain terms, whether your plan held up, whether something needs attention, or whether a conversation with an advisor is worth scheduling.
That certainty, whatever the answer, is more valuable than uncertainty. Worry without information is among the most costly financial states you can be in.
73% of affluent investors age 50 and older are concerned about their ability to generate income in retirement. Janus Henderson Investor Survey, 2025. 1,504 investors age 50+ with $250,000 or more in investable assets
Before You Run the Checks
Most people will pass all four. But the people who find a gap and address it now will handle the next volatile period with a different kind of confidence than those who waited. These checks take about five minutes each. Together, they tell you whether your plan held up, or whether something needs attention before it matters more.
Each check maps to one of three structural pieces: your income floor, your short-term cash buffer, and your investment mix. Those three pieces determine whether a retirement plan can survive a volatile market. If they are in place, a market swing is uncomfortable but not dangerous. If one has a gap, that gap is the thing to address.
If You Have Not Read the Strategy Article Yet
Stop Trying to Predict the Market. Build a Plan That Does Not Need To. It explains the three structural pieces that make market volatility far less dangerous, and why most investors consistently earn less than the markets they are invested in.
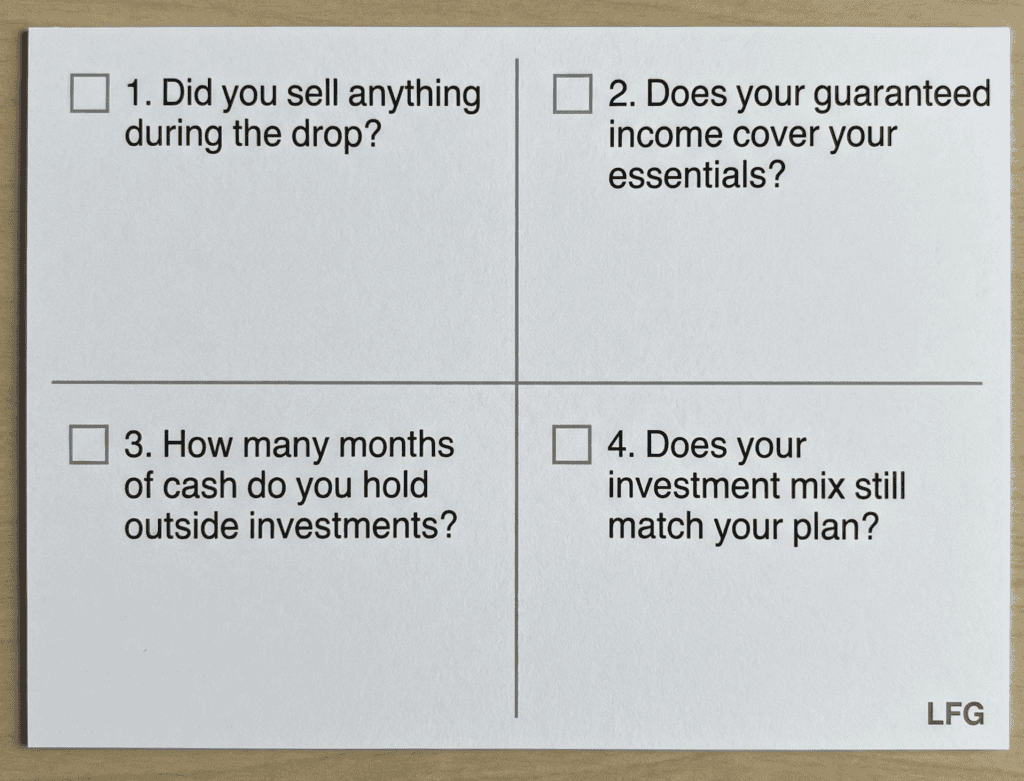
CHECK 1

Did You Sell Anything During the Drop?
This is the most important check of the four. It is also the one most people skip because it is uncomfortable to answer.
If the answer is yes, that is not a failure. It is information. Behavioral research has consistently found that investors who sell during a downturn often stay in cash long after markets recover, missing the gains that would have recouped their losses. The pattern of selling during a decline and waiting on the sidelines is one of the most common and costly in investing.
How to Run This Check
- Log into your investment account and pull up your transaction history.
- Filter for the period between early February 2026 and April 15, 2026.
- Look for any sale of equity holdings, transfer to cash, or movement from stocks to bonds that was not part of a scheduled rebalancing.
- Write down the dollar amount and the date.
If You Did Not Sell Anything
Your plan passed the most fundamental test of a volatile period. Staying invested during a decline is not easy. The Janus Henderson 2025 investor survey found that 50% of investors reported checking their accounts more frequently during recent market swings.
Checking and not acting is harder than it sounds. If you stayed invested and the structure held, that is a meaningful result worth noting.
The question worth confirming: was your ability to stay invested because you had a plan and a buffer, or because you happened not to need money and got lucky with timing?
If it is the latter, the next three checks will tell you whether that luck would hold in a longer downturn.
If You Did Sell
The recovery in April did not restore the shares you sold in March. The market came back. Those specific shares are gone.
What that cost you depends on the amount, the date of the sale, and how much the positions recovered afterward. That number is worth calculating, not to generate regret, but to understand the actual cost of the decision.
What the Math Looks Like
Suppose you sold about $50,000 in equity holdings in March 2026, when markets were near their low. Markets recovered roughly 7% over the following weeks.
On those shares, you captured the decline but not the recovery. Had you held, the shares would have recovered most or all of their value. The market came back. Those specific shares did not, because they were already sold.
This is not about blame. It is about whether the structure that led to that decision has been addressed.
If you are between 50 and 64:
The bigger question is what caused the sale. If it was a structural gap, the time to address it is before retirement, not during it.
If you are between 65 and 73:
This age range carries the highest withdrawal timing risk. If you sold to cover living expenses, building an income floor and cash buffer prevents that decision from being forced next time.
If you are 73 or older:
If you sold to cover a Required Minimum Distribution, that is a different situation from an emotional reaction. Ask whether the RMD came from the right account at the right time. And ask whether future distributions can be structured to reduce the need to sell long-term holdings during downturns.
CHECK 2
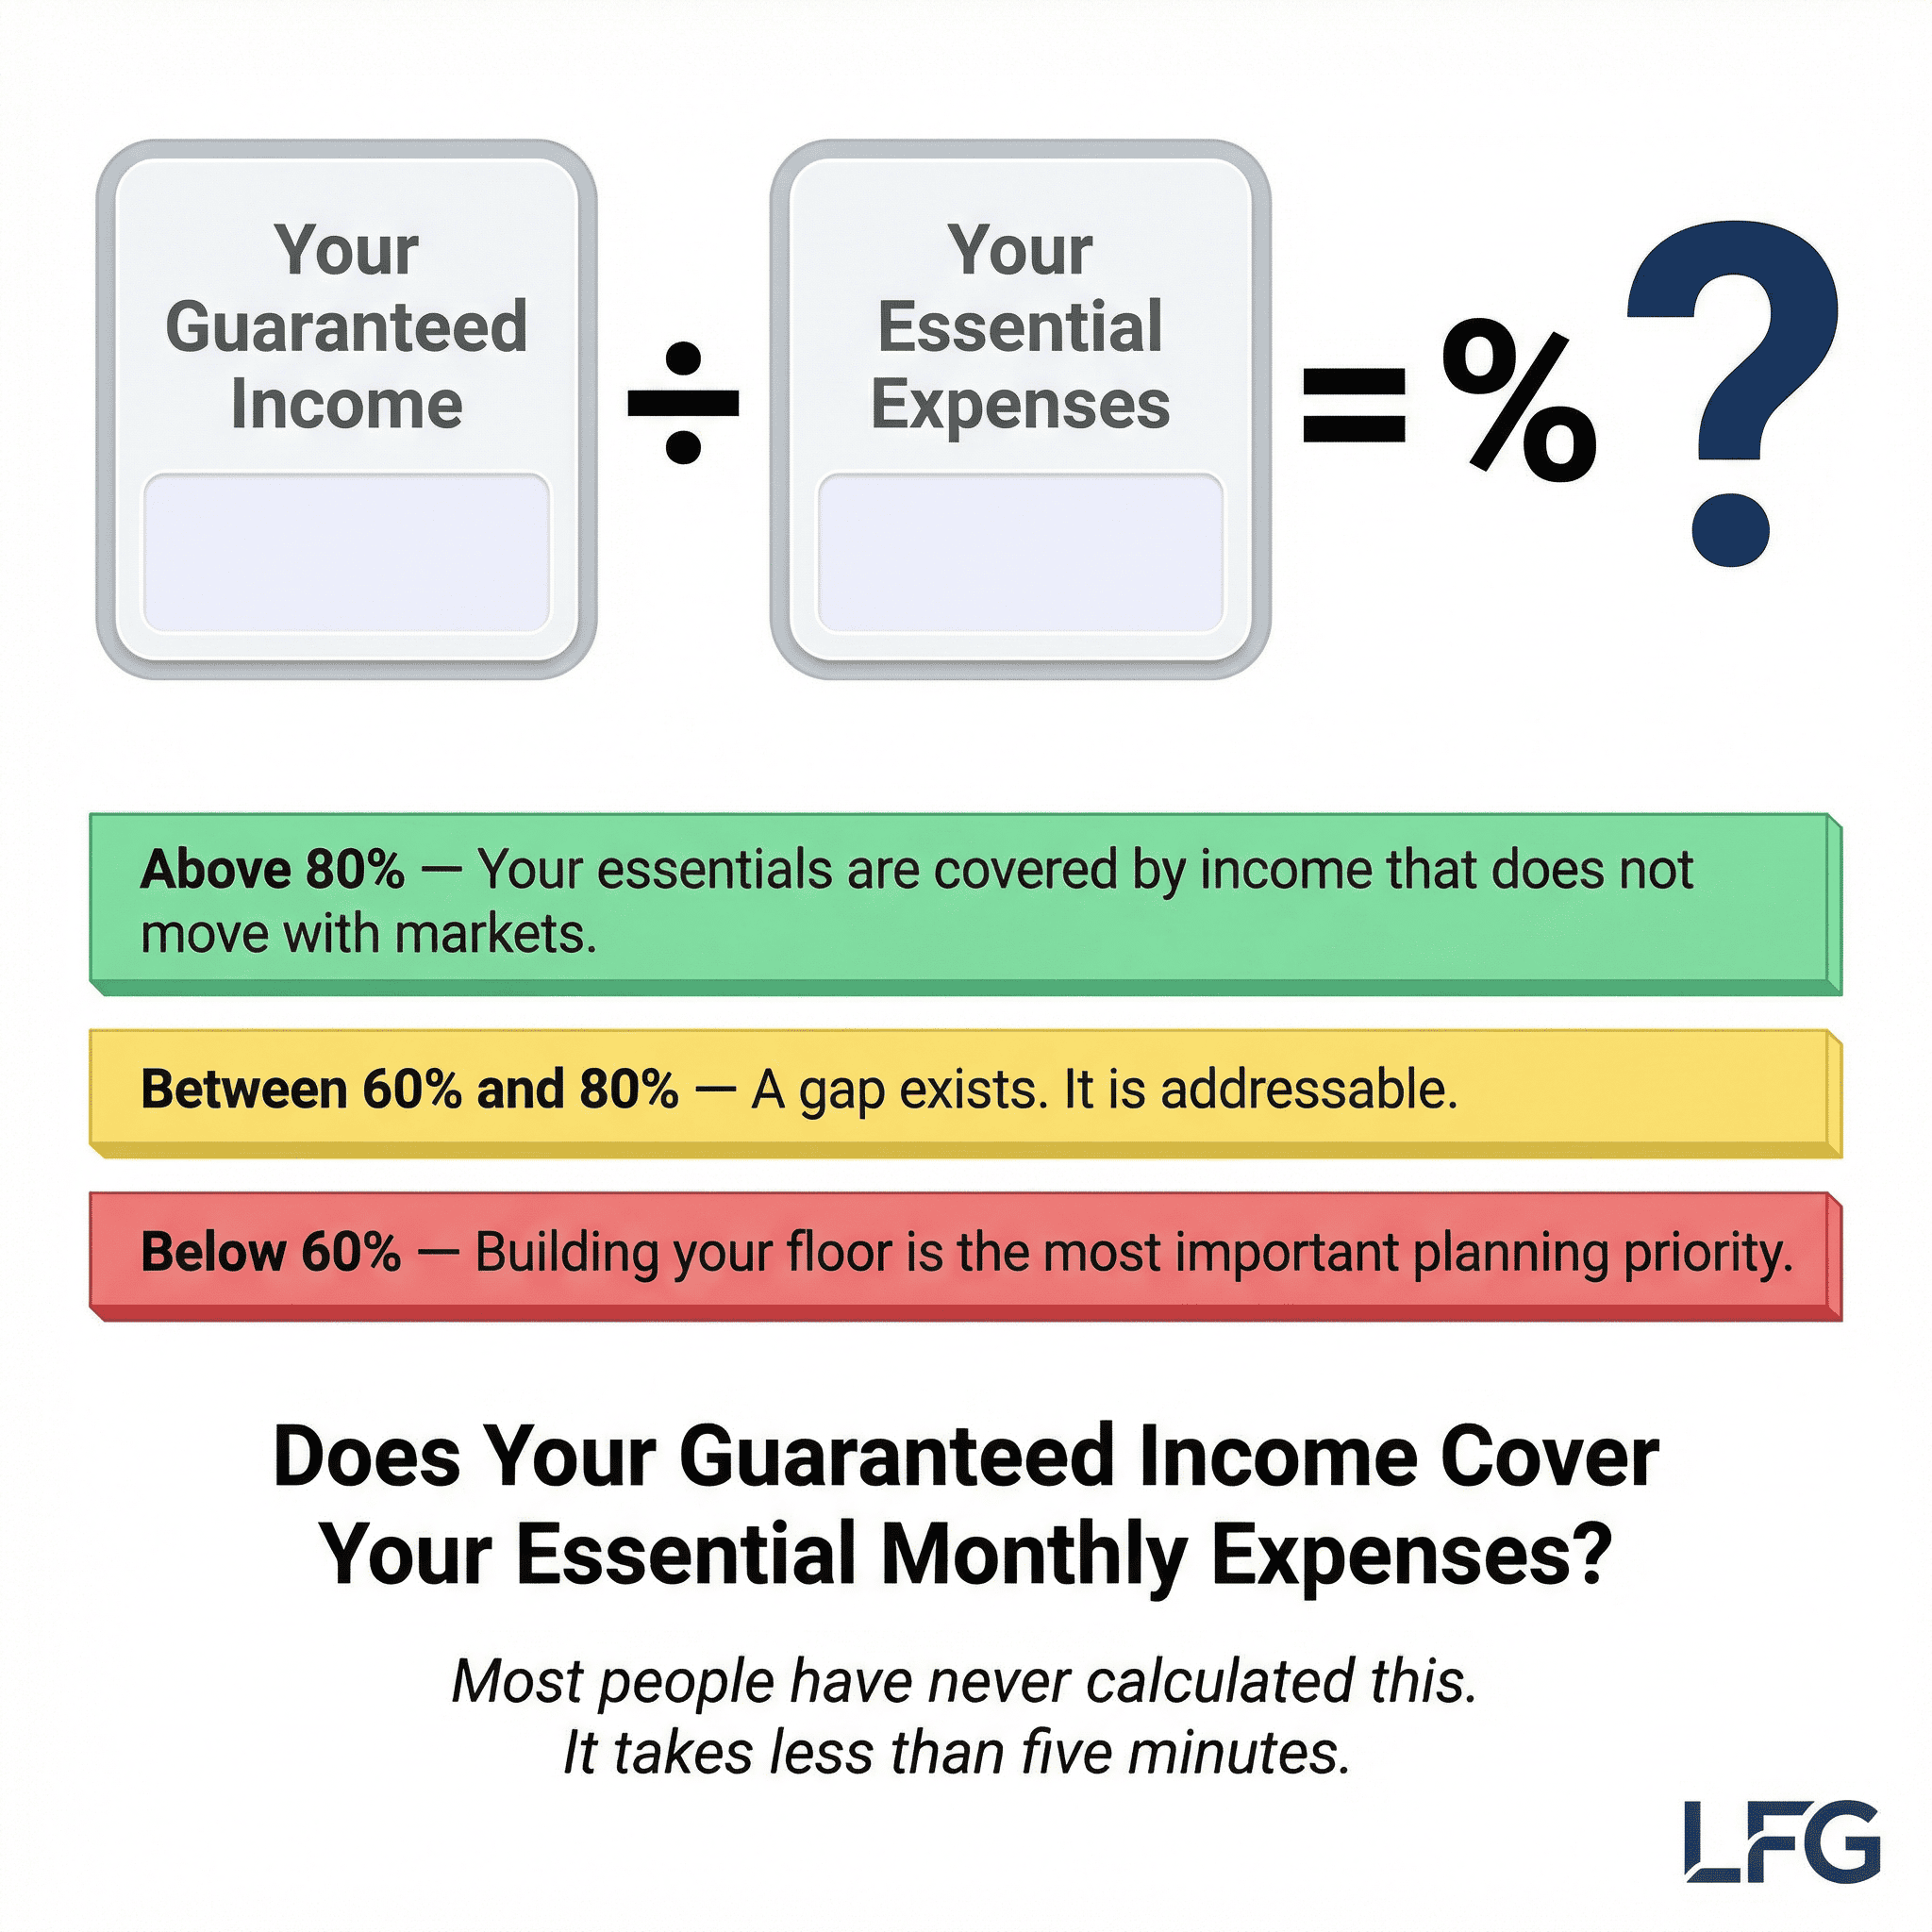
Does Your Guaranteed Income Cover Your Essential Monthly Expenses?
This is the income floor check. It is the single most useful number in retirement planning, and most people have never calculated it. Some people will run this check and feel relieved.
Others will find a gap they did not know was there. Either result is valuable. Neither one changes what happened in the market.
Both change what you do next.
Some income in retirement arrives no matter what markets do: Social Security, a pension, annuity income. That income does not fluctuate. It does not require selling anything.
It just shows up. Planners call this guaranteed income or an income floor. Your essential monthly expenses are the costs that do not go away regardless of market conditions: housing, utilities, food, insurance, and healthcare.
Divide your guaranteed income by your essential expenses and you get one number that tells you how dependent your essential lifestyle is on your portfolio staying healthy.
How to Run This Check
- Add up all monthly income from sources that do not depend on markets: Social Security (your full monthly benefit), any pension income, any annuity income.
- Add up essential monthly expenses: mortgage or rent, utilities, groceries, insurance premiums, healthcare costs, and any regular obligations that cannot be reduced in a bad year.
- Divide the guaranteed income by the essential expenses.
- Multiply by 100 to get a percentage.
What Your Number Means
Above 80%: Your essential expenses are largely covered by income that does not move with markets. A significant portfolio decline would affect your quality of life but would not threaten your essential living costs. This is a structurally sound position.
Between 60% and 80%: A meaningful gap exists. A portion of your essential expenses depends on portfolio distributions. This is manageable but means that a prolonged decline would require spending adjustments to essential costs, not just discretionary ones.
Below 60%: Your essential lifestyle is significantly dependent on portfolio performance. This does not mean you are in trouble, but it does mean that the structural work of building a stronger income floor is worth prioritizing.
A Concrete Example
Suppose your guaranteed monthly income is about $3,800 from Social Security and a small pension. Your essential monthly expenses total about $5,200 for housing, utilities, groceries, insurance, and healthcare.
Dividing $3,800 by $5,200 gives about 73%. That means roughly 73% of your essential costs are covered by income that does not depend on markets. The remaining 27%, or about $1,400 per month, currently depends on portfolio distributions.
In a calm market, that is fine. In a significant and prolonged downturn, that $1,400 per month must come from somewhere. The question is whether the plan accounts for that source explicitly.
If you are between 50 and 64:
Your guaranteed income number may be low or zero right now. Running this check now shows you what your floor will look like at retirement and how much time you have to build it up.
If you are 65 and older:
If your number is below 60%, that does not mean your retirement is in trouble. It means you have identified the most important structural priority to work on before the next volatile period arrives.
CHECK 3
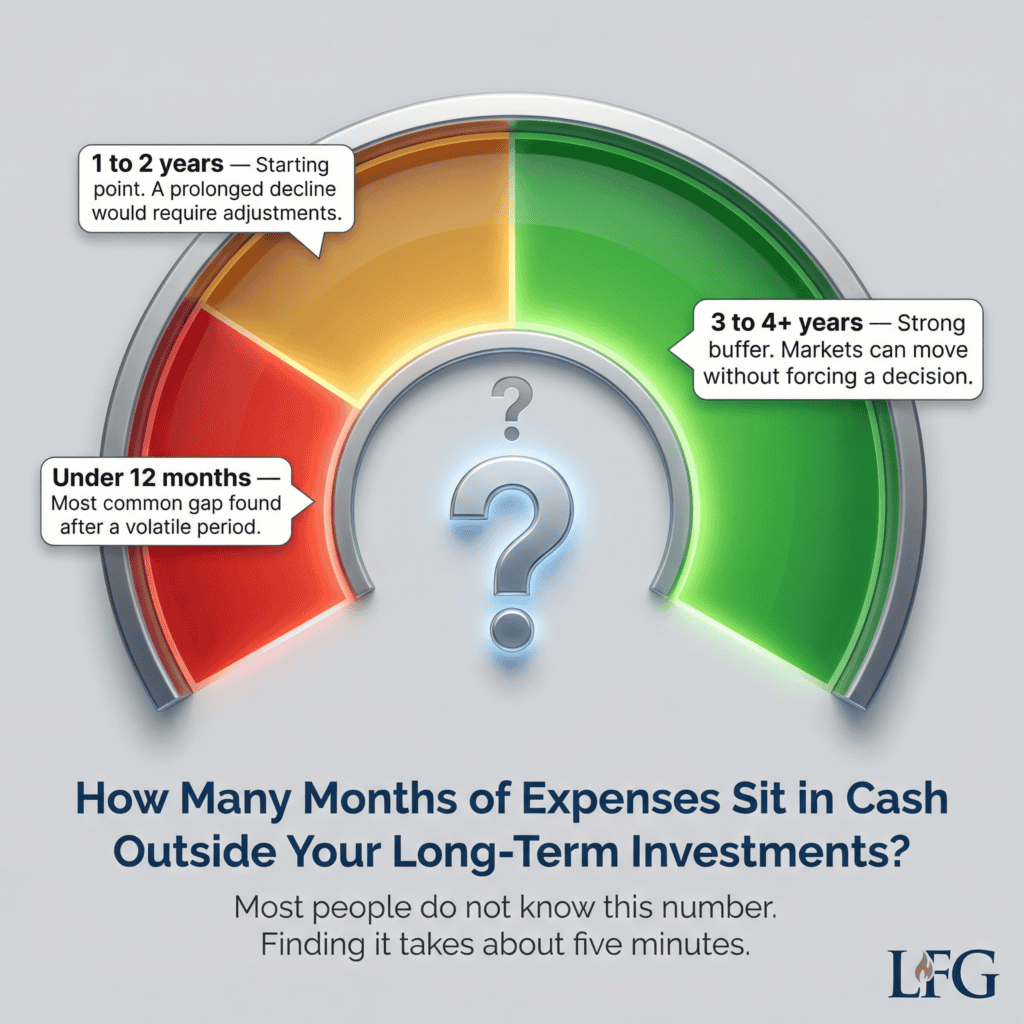
How Many Months of Expenses Sit in Cash Outside Your Long-Term Investments?
This is the buffer check. It measures whether you have the structure in place to avoid selling long-term investments during a market decline. Of the four checks, this is the one most likely to produce a gap. It is also the one that is most directly fixable.
A short-term cash buffer is simply the money you keep outside your long-term investments: savings accounts, money market accounts, CDs. When markets drop, you draw from this reserve instead of selling investments. The buffer buys time. It is measured in years of planned withdrawals, not in dollars alone.
The Schwab Center for Financial Research analyzed bear markets from the 1960s through 2021 and found that the average time for a diversified stock index to fully recover from a bear market was about 3.5 years. That is the practical basis for the recommendation. If a decline lasted the average bear market, you would need roughly three to four years of planned withdrawals in short-term savings. That keeps you from being forced to sell long-term investments at reduced prices while waiting for recovery.
How to Run This Check
- Find your savings accounts, money market accounts, CDs, and any short-term bond holdings that are separate from your long-term investment portfolio.
- Add up the total dollar value of those holdings.
- Estimate your planned annual withdrawal from your investment portfolio (not including guaranteed income).
- Divide the cash and short-term holdings total by the annual withdrawal to get your buffer in years.
What Your Number Means
3 to 4 years or more: This is a structurally strong buffer. Based on historical bear market recovery data, this range covers the average recovery period without requiring long-term investment sales during a decline.
1 to 2 years: This is a reasonable starting point. It protects against a short decline, but a prolonged downturn of 2 to 3 years would require either drawing on long-term investments or reducing spending. Consider whether building toward 3 years is feasible.
Less than 12 months: This is the most common gap found after a volatile period. If you had to make any investment sales during this spring’s decline to cover expenses, a buffer gap is likely the reason. Building a short-term cash position while markets are calm is the first structural priority.
One honest note: building a cash buffer feels counterproductive when cash returns are low and stock markets are rising. That is the exact moment when most people let the buffer stay small. It is also the exact moment when building it is easiest, because you are not being forced to sell anything to do it.
Why the Buffer Matters More Than Most People Realize
A retiree with no cash buffer and a plan to withdraw about $40,000 per year would need to sell about $80,000 in investments over a two-year downturn at reduced prices.
A retiree with 2 to 3 years in short-term savings draws from that buffer instead. The long-term investments stay invested through the decline and recovery.
Both held the same investments. One structure turned a temporary event into a permanent outcome. The other did not.
If you are between 50 and 64:
An emergency fund covering 6 to 12 months of expenses is the right measure at this stage. The retirement buffer becomes critical in the three to five years before you stop working.
If you are 65 and older:
If your buffer is below 12 months, that is the most actionable finding in this article. Build it now, while markets are calm. It is harder to build during a decline.
CHECK 4
Does Your Investment Mix Still Match Your Original Plan?
Markets moved significantly this spring. A 7% decline followed by a recovery of similar size means that your investment mix almost certainly shifted from where it was in January, even if you did nothing.
Your investment mix, which planners also call your allocation, is simply the percentage of your money in stocks versus bonds versus cash. Think of it as three buckets. Stocks for long-term growth.
Bonds and cash for stability and near-term needs. Most people set a target mix with their advisor and then forget to check whether it still matches their plan after a volatile period.
If you have never defined a target mix, or you are not sure what yours is, this check will surface that too. Not knowing your target is itself a finding. It does not mean anything is broken. It means there is a conversation worth having.
How to Run This Check
- Log into your investment account and find the current breakdown of your holdings by type: stocks (or equity funds), bonds (or fixed income), and cash.
- Express each as a percentage of your total portfolio value.
- Find the target allocation you agreed on with your advisor, or the allocation that reflects your timeline and income needs. If you do not know your target, write down that question.
- Compare current to target. Note any category that differs by more than 5 percentage points.
What the Numbers Mean
Within 5 percentage points of target in all categories: Your mix held through the volatility. A brief check confirms the plan is intact.
5 to 10 points off in one category: The market moved your mix. This is the normal result of a volatile period and is straightforward to address through rebalancing, which means returning the mix to the target without making a market prediction.
More than 10 points off, or you do not know your target: This is worth a conversation with an advisor. A mix that is significantly off target, or a target that was never defined, means your portfolio may be taking on more or less risk than your plan assumes.
Rebalancing Is Maintenance, Not a Market Call
Suppose your target is 60% stocks and 40% bonds. Stocks fall faster than bonds during the decline, shifting your mix to 55% stocks and 45% bonds.
Markets recover. Your stocks bounce back, but since you hold fewer of them than your plan called for, you capture less of the recovery.
A rebalancing check, done once or twice a year, catches this and returns the mix to the plan. It does not predict markets. It just keeps the portfolio running the way it was designed.
If you are between 50 and 64:
A drift toward more conservative holdings is the more common risk at this stage. If your stock percentage dropped during the decline and stayed low, your portfolio may now be too cautious for a timeline that still has 10 to 20 years of growth ahead.
If you are 65 and older:
A drift toward more aggressive holdings after a fast recovery is the more common risk at this stage. If your stock percentage rose and you have not rebalanced, you may now carry more risk than your income plan assumed.
Reading Your Results
These four checks are not a report card. Here is how to interpret what you found.
All Four Checks Are Clear
Your plan held up. Not because markets were kind, but because the structure you built absorbed the volatility the way it was designed to. Staying invested through a 7% decline and a fast recovery without making reactive decisions is something the data shows most investors struggle with.
Take a moment with that result. It is more meaningful than it sounds.
Your action: write down what you found in each of the four checks and put it somewhere you can find it before the next volatile period. The specifics, including your buffer number, your floor percentage, and your current mix, are the reference points that let you check quickly next time instead of checking anxiously.
One or Two Minor Gaps
You have found something worth addressing. A buffer below one year, a mix that has drifted 5 to 10 points, or an income floor below 60% is not a crisis. Each one is easier to address in a calm market than in a declining one.
Your action: pick the one gap that showed up most clearly and bring it to your next advisor conversation with the specific number you calculated. Not a vague concern, but the actual result. Your buffer is 6 months.
Your floor is 58%. Your mix drifted 8 points. That level of specificity changes the conversation from general worry to a plan.
A Significant Gap on Check 1 or Check 3
If you sold during the decline or your cash buffer is near zero, you have found the most important structural finding this article can surface. These two gaps are connected. People who sell during declines almost always do so because they have no buffer. There is no other way to cover near-term expenses.
If you are feeling regret about a sale made during the decline, that feeling is understandable. Watching your savings drop by tens of thousands of dollars and feeling compelled to act is a completely human response. The research suggests it happens because of structural pressure, not bad judgment. The question now is what changes would prevent that same pressure from arising next time.
Your action: schedule a planning conversation before the end of the month. Not at year-end. Now, while the memory of the decision is fresh and markets are calm. The specific question to bring: what would need to be in place so that a repeat of this spring’s decline does not put me in the same position again?
One More Thing Worth Knowing
Vanguard’s Advisor’s Alpha research found that behavioral coaching adds about 1.5% in net annual returns. That means helping investors stay disciplined during market volatility is the single most valuable service their research finds that a financial advisor provides.
On a $500,000 portfolio, 1.5% per year is about $7,500 annually. Over a 20-year retirement, that compounds significantly, not from better fund selection, but from preventing reactive decisions during difficult periods.
📅 Did any of these four checks reveal a gap you weren’t expecting? Schedule a 30-minute planning review to work through your specific numbers and see what, if anything, needs attention before the next market swing. Visit langanfinancialgroup.com/get-started-today or call 717-288-1880.
These four checks are a version of that coaching you can run yourself. The plan is not the hard part. Sticking to it when everything feels urgent is. The people who manage that best are usually the ones who have both a structure and someone who can help them see it clearly when markets make it hard to.
You now know which category you are in. That is more than most people know. If any of these four checks revealed a gap, that gap is useful information.
We offer a planning review that works through each check in your specific situation and identifies what, if anything, needs attention. No sales pitch. Just a clear picture.
Visit langanfinancialgroup.com/get-started-today or call 717-288-1880.
About the Financial Planning Author

Alexander Langan, J.D, CFBS, serves as the Chief Investment Officer at Langan Financial Group. In this role, he manages investment portfolios, acts as a fiduciary for group retirement plans, and consults with clients regarding their financial goals, risk tolerance, and asset allocation.
With a focus on ERISA Law, Alex graduated cum laude from Widener Commonwealth Law School. He then clerked for the Supreme Court of Pennsylvania and worked in the Legal Office of the Pennsylvania Office of the Budget, where he assisted in directing and advising policy determinations on state and federal tax, administrative law, and contractual issues.
Alex is also passionate about giving back to the community, and has participated in The Foundation of Enhancing Communities’ Emerging Philanthropist Program, volunteers at his church, and serves as a board member of Samara: The Center of Individual & Family Growth. Outside of work and volunteering, Alex enjoys his time with his wife Sarah, and their three children, Rory, Patrick, and Ava.
About Langan Financial Group: Financial Advisors
Langan Financial Group is an award-winning financial planning firm with offices in York, Pennsylvania and Harrisburg, Pa.
With over 150+ 5-star reviews, Langan Financial Group is an independent financial planning firm established in 1985, offering a broad range of financial planning services.
With an open architecture platform, our advisors have access to a diverse range of products, free from any sales quotas.
Our team of 11 financial experts, each with unique specialties, enhances our ability to focus on delivering value to our clients.
Disclosure
The content is developed from sources believed to be providing accurate information. The information in this material is not intended as tax, financial or legal advice.
Please consult financial, legal, or tax professionals for specific information regarding your individual situation.
The opinions expressed and material provided are for general information, and should not be considered a solicitation for the purchase or sale of any security.
Hypothetical and illustrative examples are for educational purposes only and do not represent the results of any specific investment or individual. Individual results will vary based on specific financial circumstances. Dollar figures in hypothetical examples are approximate and for illustration purposes only.
References to income floors, cash buffers, and investment mix strategies are general planning concepts and are not specific recommendations for any individual. The income floor percentage calculation is a planning illustration only and does not constitute a guarantee or projection of retirement income adequacy. Social Security claiming decisions depend on individual circumstances and no single strategy is appropriate for everyone.
IRMAA surcharge thresholds are subject to annual adjustment by the Centers for Medicare and Medicaid Services. Please consult a qualified financial, tax, or legal professional before making any financial decisions. Securities offered through Cambridge Investment Research, Inc., a Broker-Dealer, Member FINRA/SIPC.
Securities offered through Cambridge Investment Research, Inc., a Broker/Dealer, Member FINRA/SIPC.
Investment Advisor Representative, Cambridge Investment Research Advisors, Inc. a Registered Investment Advisor. Cambridge and Langan Financial Group, LLC are not affiliated.
Cambridge does not offer tax or legal advice.